
October 11 main slate. Data checked October 6, 2026 at 9:23 PM ET. This is a dated analysis; confirm current prices and player availability before lock.
J.K. Dobbins carries a 5.2-point historical average in the DraftKings salary file, yet our Week 5 calculation estimates 13.2 points. Jaxon Smith-Njigba's reported average is 31.4, while our estimate is 24.6. Neither difference, on its own, proves that a player is a bargain, a fade or due for a particular result.
Historical points per game summarize recorded output. A projection estimates a future game using a model's inputs and assumptions. Salary is the price of including that player on a specific platform and slate. Keeping those three concepts separate improves DFS comparisons and prevents misleading arguments in season-long trade discussions.
| Player | DK salary | Reported DK PPG | Frumpy Duck DK estimate |
|---|---|---|---|
| J.K. Dobbins | $5,000 | 5.2 | 13.2 |
| Jaxon Smith-Njigba | $8,800 | 31.4 | 24.6 |
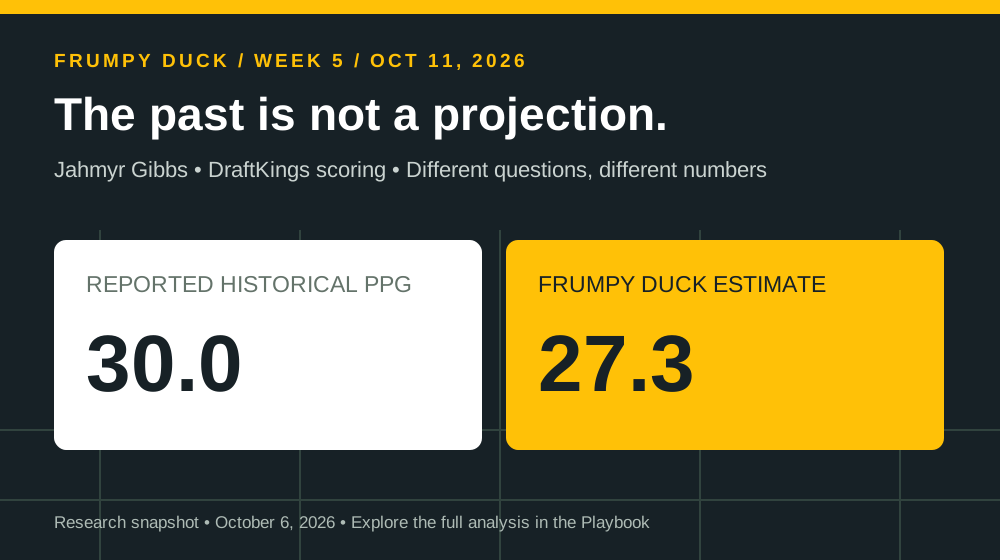
| Jahmyr Gibbs | $9,800 | 30.0 | 27.3 |
A projection gap is a research prompt
Dobbins' estimate exceeds his historical average by roughly eight points. That gap should prompt questions about expected opportunity, health and the model's assumptions. It should not be rewritten as a factual report that his workload has increased. Our snapshot does not independently establish a change in snap share, routes or goal-line usage.
For Smith-Njigba and Gibbs, a lower estimate than historical average is not sufficient evidence that a decline is imminent. The model may be more conservative, the matchup may differ, or past scoring may include events that are not represented in the estimate. In this case, the DraftKings calculation explicitly omits yardage bonuses, fumbles and rare scoring events. That limitation matters when comparing it with actual platform scoring.
Cost per point measures the past unless you specify otherwise
Frumpy Duck's cost-per-point column divides salary by historical PPG. Smith-Njigba's $8,800 salary divided by 31.4 PPG is approximately $280 per historical point. Dobbins' $5,000 divided by 5.2 is approximately $962. The cheaper player is not automatically the better historical value.
Using projected points creates a different metric. Dobbins' unrounded 13.15-point estimate produces about 2.63 projected points per $1,000. That is a forward-looking model comparison, not the reciprocal of his historical cost per point. Always label the denominator. A ratio without a clear scoring basis can make incompatible arguments look precise.
Do not compare platform points as if scoring were identical
DraftKings and FanDuel use different reception scoring and bonus rules. A receiver's point estimate can therefore change even when the underlying expected stat line is similar. A $6,000 salary also represents 12% of the DraftKings Classic cap but 10% of FanDuel's cap. Raw price differences do not tell the whole story.
The current FanDuel feed does not supply historical PPG. Lineup Lab leaves that value unknown and labels projection-based suggestions explicitly. Filling the blank with DraftKings PPG would create a cleaner-looking table at the expense of a valid comparison.
An optimal lineup is only optimal for its inputs
When Lineup Lab labels a suggestion “top possible averages,” its optimizer has proved that no legal combination in the available pool has a higher sum of the supplied historical averages under the selected roster and salary rules. That is a mathematical statement about the input data—not a forecast that the lineup will score the most points on Sunday.
Stacked, top-heavy and balanced suggestions answer different questions. A stack concentrates exposure to a shared offensive outcome. A top-heavy build prioritizes a QB/RB/WR core. The balanced model rewards relative strength across positions. Comparing those options reveals the trade-offs more clearly than presenting one total as a universal answer.
Bring the same discipline to your trade negotiations
In season-long leagues, compare the starter you would gain with the player who would actually leave your lineup. Then examine role stability, health, upcoming roster gaps and your league's scoring. A DFS salary can be useful context for a particular game, but it is not a rest-of-season trade valuation. Four weeks of averages are evidence to investigate, not a complete explanation of a player's value.
Open Team Analysis for roster fit and Lineup Lab for slate-specific comparisons. Use the tool that matches the question, and keep the data's time frame visible.
Sources and methodology
Analysis uses a frozen snapshot checked October 6, 2026 at 9:23 PM ET, for the October 11, 2026 main slate. Prices, projections, weather and availability can change. These articles are dated research, not an automatically updated player feed.
- DraftKings official salary CSV, draft group 154468 — salaries and reported historical PPG.
- FanDuel Research NFL DFS projections — Main slate 2116774; FanDuel salaries and point projections.
- ESPN Week 5 game data and ESPN team statistics — game context and defensive averages. Frumpy Duck ranks defenses by fewest allowed per game; ties share a rank.
- Sleeper player data — depth-chart and injury listings, which do not guarantee game-day availability or playing time.
- Archived data used in these articles.
DraftKings estimates are Frumpy Duck calculations from FanDuel-projected passing, rushing and receiving statistics, rescored for full PPR. They omit yardage bonuses, fumbles and rare scoring events. They are not official DraftKings projections. A blank estimate remains blank. FanDuel figures use its own scoring. No ownership, snap share or probability of winning is inferred.