
October 11 main slate. Data checked October 6, 2026 at 9:23 PM ET. This is a dated analysis; confirm current prices and player availability before lock.
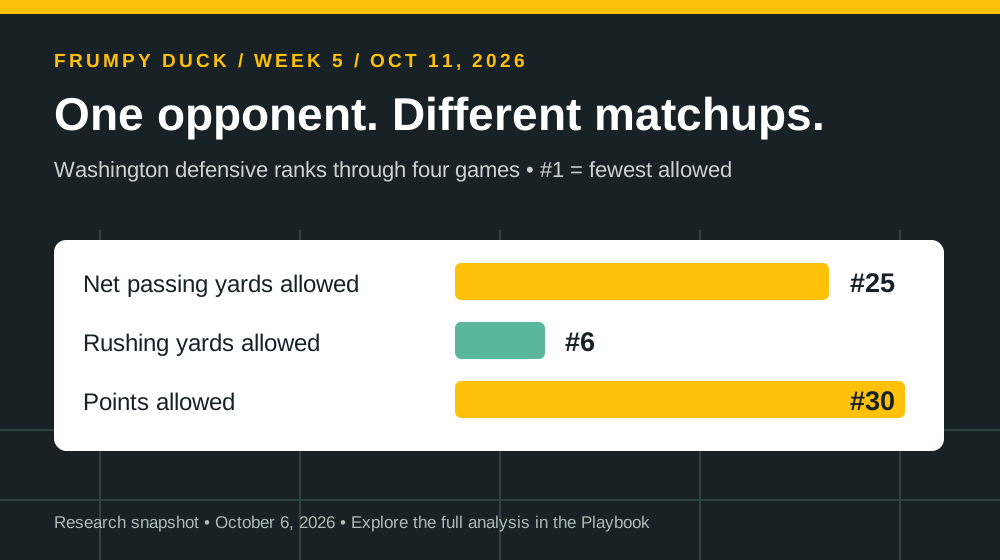
Washington enters this week's data snapshot allowing 30.5 points per game, yet ranks sixth-best in rushing yards allowed. Las Vegas is eighth against net passing yards and 27th against rushing yards. A single “good matchup” label would conceal the most useful part of both comparisons.
For season-long managers setting a FLEX and DFS players comparing salaries, the question is not simply whether the opponent is good. It is which aspect of that defense matters to the player's expected role. The following examples use 2026 regular-season averages through four games, with ranks calculated across all 32 teams. First means fewest allowed.
| Opponent | Net pass yards allowed / game | Rush yards allowed / game | Points allowed / game |
|---|---|---|---|
| Washington | 242.5 · #25 | 93.5 · #6 | 30.5 · #30 |
| Las Vegas | 202.8 · #8 | 134.5 · #27 | 21.0 · tied #11 |
| San Francisco | 209.0 · #11 | 99.8 · #9 | 16.0 · #3 |
Giants at Washington: separate the rushing and receiving cases
Cam Skattebo and Isaiah Likely face the same defense, but their cases should not be identical. Washington's low rushing-yard allowance is a reason to examine the assumptions behind a Skattebo rushing projection. Its higher net passing-yard allowance makes receiving involvement a different research question.
Those numbers still do not tell us how Washington performs specifically against tight ends, nor do they measure Skattebo's receiving workload. They are team-level defensive totals. For Likely, look for evidence of route participation and targets before turning a favorable passing statistic into a confident start. For Skattebo, inspect projected and recent touches rather than assuming every high-scoring opponent is easy to run against.
Raiders at Patriots: salary and matchup can point in different directions
Romeo Doubs and Hunter Henry make our DFS value shortlist because of their prices and estimated points. That is compatible with acknowledging that Las Vegas has allowed relatively few net passing yards. A player can be attractively priced without having the easiest matchup.
The Raiders' 134.5 rushing yards allowed per game give New England's backfield a different statistical backdrop. They do not establish which running back will receive the most carries, passing-down work or goal-line opportunities. Confirm the current depth and practice reports, then consider how much of the anticipated opportunity is supported by actual usage.
49ers at Seahawks: a premium receiver still carries opportunity cost
San Francisco's 16.0 points allowed per game is the strongest scoring-defense mark among these three opponents. Jaxon Smith-Njigba remains an expensive way to access Seattle's passing game: $8,800 on DraftKings and $9,300 on FanDuel in the snapshot. The relevant decision is whether his expected contribution exceeds the alternatives after accounting for the rest of the roster.
For a season-long lineup, an opponent rank alone is usually too little information to justify benching a strong established starter. For DFS, price creates another comparison: the same player can be a reasonable season-long start and a difficult salary-cap fit. Evaluate the replacement, not just the matchup label.
Weather belongs in the review—but not as an invented adjustment
ESPN's game-attached forecast snapshot lists Seattle at 62°F with sunny conditions and New England at 66°F with intermittent clouds for Sunday's games. These are forecasts retrieved Tuesday evening, not live conditions or promises about kickoff weather. Recheck closer to the game, particularly when wind or precipitation becomes relevant.
An indoor venue introduces another distinction: an outdoor forecast is not necessarily the playing environment, and a stadium's indoor classification does not confirm the roof position. The player popup in Lineup Lab labels these limitations. We have not applied a numerical weather penalty to player projections.
Use the ranking to ask a better question
A four-game defensive average is descriptive. Opponent quality, pace, possession and game script can all influence it, and this table is not adjusted for those factors. Use it to identify what needs checking: role, usage, scoring format and the available replacement. A decision supported by those details is more defensible than one driven by a red or green matchup badge.
Sources and methodology
Analysis uses a frozen snapshot checked October 6, 2026 at 9:23 PM ET, for the October 11, 2026 main slate. Prices, projections, weather and availability can change. These articles are dated research, not an automatically updated player feed.
- DraftKings official salary CSV, draft group 154468 — salaries and reported historical PPG.
- FanDuel Research NFL DFS projections — Main slate 2116774; FanDuel salaries and point projections.
- ESPN Week 5 game data and ESPN team statistics — game context and defensive averages. Frumpy Duck ranks defenses by fewest allowed per game; ties share a rank.
- Sleeper player data — depth-chart and injury listings, which do not guarantee game-day availability or playing time.
- Archived data used in these articles.
DraftKings estimates are Frumpy Duck calculations from FanDuel-projected passing, rushing and receiving statistics, rescored for full PPR. They omit yardage bonuses, fumbles and rare scoring events. They are not official DraftKings projections. A blank estimate remains blank. FanDuel figures use its own scoring. No ownership, snap share or probability of winning is inferred.